Zhang Wei Zhou Yue
Thermo Fisher Scientific (China) Co., Ltd.
Key words
Post-translational modification; DIA; spectral library; phosphorylation; quantitative proteomics
introduction
Data-Independent Acquisition (DIA) is one of the most popular mass spectrometry acquisition technologies. It divides the mass range into several windows in a non-target manner, and sequentially and cyclically collects the secondary fragments of all the parent ions in the window. [1,2]. Similar to SRM, DIA is also based on the metabolism of the ionization, which has better selectivity and higher accuracy than the traditional proteomics quantification method. However, DIA still has a large bottleneck in post-translational modification analysis. DIA relies on DDA to build a spectral library. When DDA data is searched, the probability of modification of the site is higher. Especially the phosphorylation modification occurs on the common S/T/Y. If the peptide contains 2 or The above position is close to S/T/Y, and the position is easy to find the wrong one. Using the identification result containing the error site information as a spectral library will result in unreliable post-translational DIA analysis results [3]. Therefore, DIA is still difficult to use for large-scale post-translational modification sample analysis.
The scoring algorithm for the modified site makes the location of the modified site more accurate. The integrated phosphoRS/ptmRS module in Proteome Discoverer software [4] and MaxQuant software algorithm [5] can achieve Site Probability. Calculate to obtain reliable site location information. Based on the above software, this paper analyzes the site reliability of post-translational modified DDA data, screens the spectrum with accurate site location, and imports the Skyline software to achieve reliable post-translational DIA analysis. Applying this procedure to the phosphorylation sample DIA data analysis, 6641 high-confidence phosphorylated peptides were successfully extracted (Q < 0.01), accounting for 98.4% of the total number of peptide peptides in the library, which can be used for accurate quantification of peptides ( CV < 20% accounted for 86.9%, effectively solving the problem of post-translational modification DIA quantification.
Experimental condition
Experimental materials and methods
Phosphorylated samples derived from rat tissue were collected at a final loading of 700 ng/run for DDA and DIA, and each acquisition pattern was repeated 3 times.
Chromatographic conditions
Nanoflow High Performance Liquid Chromatograph: EASY-nLC 1000 (Thermo Scientific)
Analytical column: nanoflow C18 column (length 15cm, ID 75 μm, particle size 3 μm)
Mobile phase: A: 0.1% aqueous formic acid; B: 0.1% formic acid acetonitrile solution
Gradient: 0–3 min, 3–7% B; 3–95 min, 7–22% B; 95–113 min, 22–35% B; 113–116 min, 35-90% B; 116-120 min , 90% B
Flow rate: 300 nL/min
Mass spectrometry condition
Mass spectrometer: Orbitrap Fusion (Thermo Scientific);
Ion source: NanoFlex; ion mode: positive ion; spray voltage: 1.8 kV; capillary temperature: 275 ° C; S-Lens RF: 60%
DDA: Resolution: Level 120,000@m/z 200, Level 30,000@m/z 200; AGC: Level 2e5, Level 2e4; Level 2 Maximum Injection Time: 100 ms; Collision Energy: HCD 30%
DIA: mass range: m/z 400–1200; window: 25 m/z (1 m/z overlap between windows, actual Isolation window set at 26 m/z); secondary resolution: 30,000@m/z 200; Level AGC: 1e5; Level 2 Maximum Injection Time: 85 ms; Collision Energy: HCD 30%; insert a level 1 scan between each DIA cycle.
data processing
Based on Proteome Discoverer 2.0 software for DDA identification, site screening, and spectral library creation, Proteome Discoverer 1.4 and MaxQuant can do the same.
Search identification parameters: Uniprot rat protein database, parent ion mass deviation: 10 ppm; fragment ion mass deviation: 0.02 Da; fixed modification: C alkylation (+57.021 Da); dynamic modification: M oxidation (M+15.995 Da S/T/Y phosphorylation (S/T/Y+79.966 Da); enzyme: trypsin; Q value (Percolator): < 0.01; ptmRS module: PhosphoRS mode: True; Use diagnostic ions: True
Site screening and spectral library creation: Screening the PSM table "Isoform Confidence Probability", retaining the results of _ 0.75, directing it into PepXML format, and directing the corresponding spectrum into mzML format. The PepXML file and the mzML file are simultaneously imported into the skyline to create a highly reliable phosphorylated peptide library.
DIA data Skyline analysis: Set the isolation window according to the DIA acquisition parameters, and use all the peptides and corresponding proteins in the spectrum library as Targets, and select 6 b/y ions with the highest intensity for each peptide to carry out peak extraction. The peak result is mProphet. A false positive evaluation was performed with a control Q value < 0.01.
Experimental result
1. Precisely modify the site map library and DIA analysis process
Since the peptide contains multiple sites that may undergo post-translational modification, if the site where the modification may occur is not scored, it will cause mismatching and localization of the post-translational modification site. Using the mismatched and positioned post-translational modified peptides as a spectral library will result in errors in the DIA resolution results. This is the bottleneck of the current post-translational DIA analysis.
Proteome Discoverer-based phosphoRS/ptmRS algorithm can score sites that may be modified to determine the accuracy of the location. Probability _ 75 (100-point scale) or 0.75 (1-point scale) sites are generally considered to be accurate and reliable; peptides with multiple modifier sites have a Probability of _ 75 (or 0.75) for all loci. The modification site and isoform are uniquely determined. Through this method, the PSM (ie, Isoform Confidence Probability 75 (or 0.75) with accurate and reliable site and unique determination of the site is selected to establish a spectral library, and accurate post-translational modification DIA analysis is realized. The whole process is shown in Figure 1.
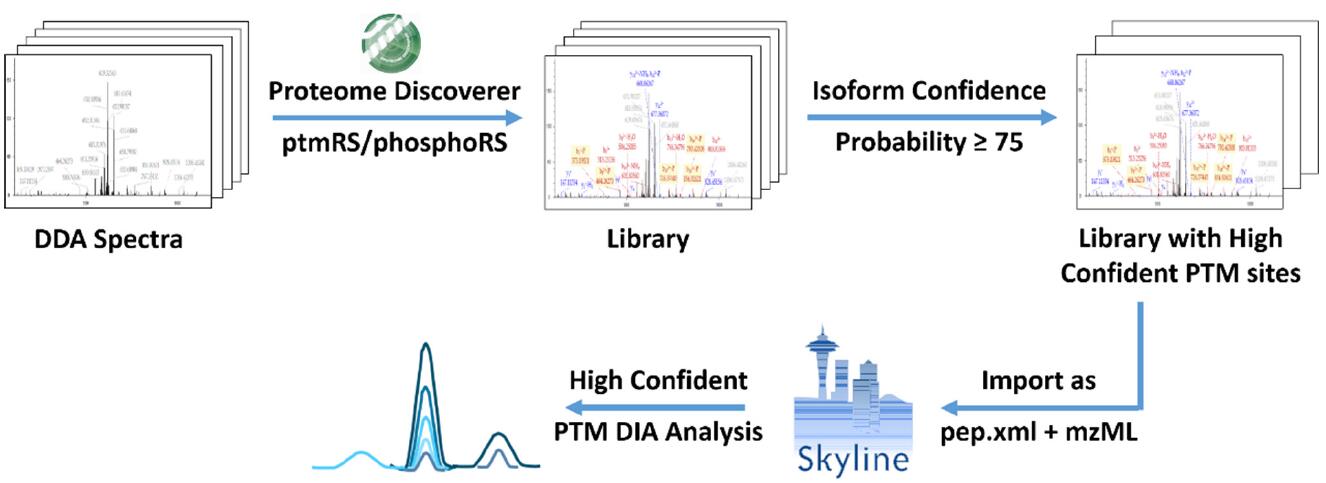
Figure 1. Flow chart for precise modification of the site map
2. DDA identification, credibility screening and spectral library establishment of phosphorylated samples
Phosphorylation sample information and chromatographic mass spectrometry parameters are found in the Experimental Conditions section. The 3-pin DDA data was identified using the Proteome Discoverer 2.0 software search library (S/T/Y+79.966 Da) according to the phosphorylation search process, and the sites were scored using the ptmRS module (Figure 2-1). After the search is complete, open the results and use the Filter function to filter the PSM list "Isoform Confidence Probability" and retain the PSM with a score greater than or equal to 0.75 (Figure 2-2). Then, right click and select "Check All-In This Table" to select the eligible PSM. Finally, export the mzML format in "Spectra", export the PepXML format in "To PepXML", and put the two files in the same folder to import Skyline as a spectrum library (Figure 2-3).
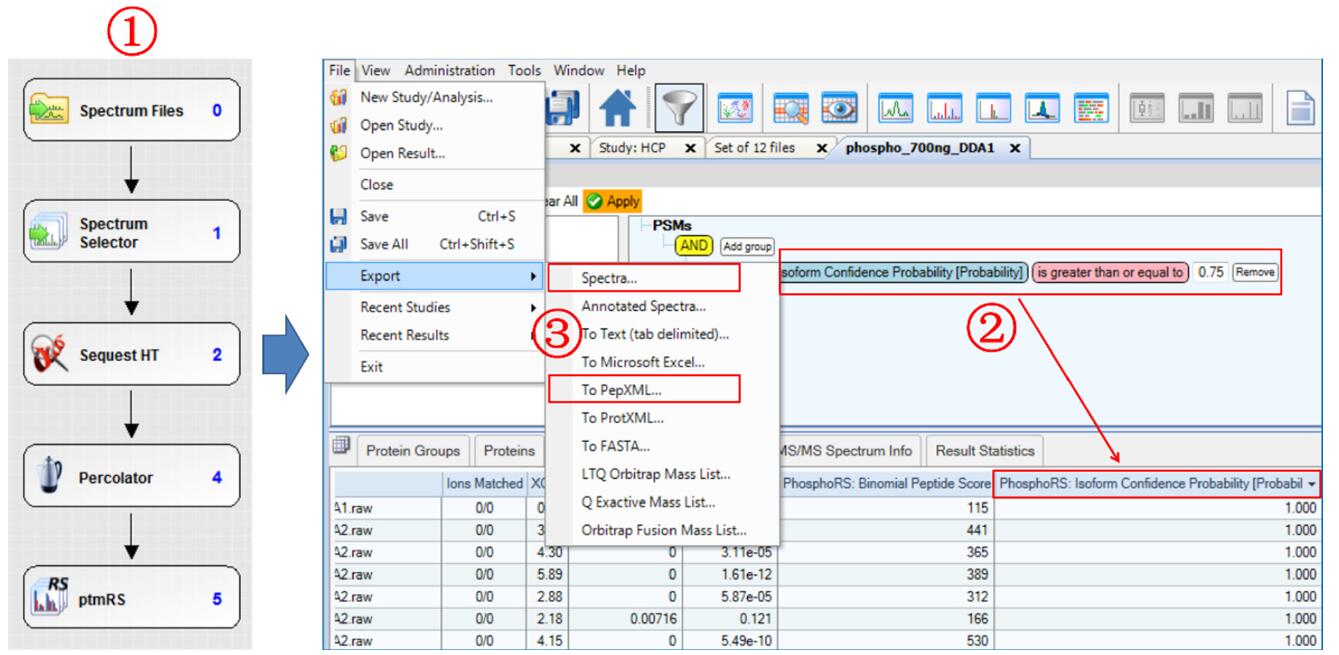
Figure 2. Post-translational modification DDA data retrieval, site screening, and result export steps
The site probability of each phosphorylation site was calculated by phosphoRS/ptmRS, and the fraction > 75 (or 0.75) had exact fragment support and reliable positioning. The search engine does not have the function of scoring points, and the probability of location error is large. Figure 3 is a typical example: the RFSVTAEGGLTLEQVTDAR peptide search library identified multiple PSMs containing one phosphorylation site, and both the serine at position 3 and the threonine at position 5 were matched to phosphorylation (FDR < 1%). ). The ptmRS scores are divided into three cases: 1) ptmRS gets the only reliable location and is consistent with the search engine's position, Isoform 100% is determined (Fig. 3-A); 2) ptmRS gets two The site is possible, the unique site cannot be determined, and the Isoform reliability is 50% (Fig. 3-B); 3) ptmRS gets the only reliable site, but it is inconsistent with the site obtained by the search engine, Isoform The reliability is 0 (Fig. 3-C). In the end, only Isoform Confidence Probability _ 75 (or 0.75) was screened, ie, peptides with clear and reliable peptides at all sites were established.
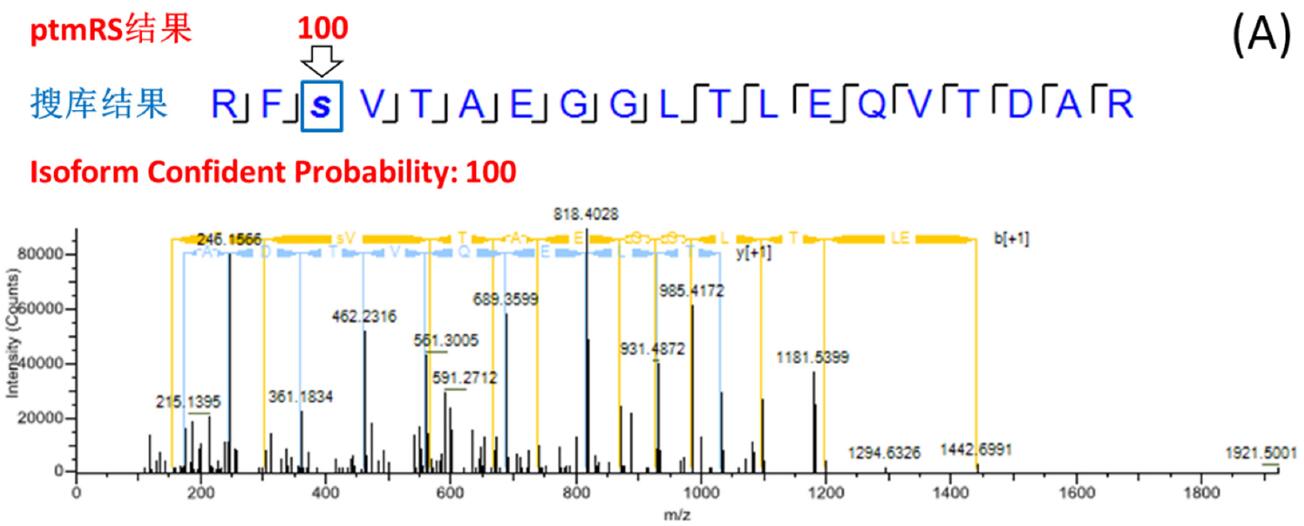
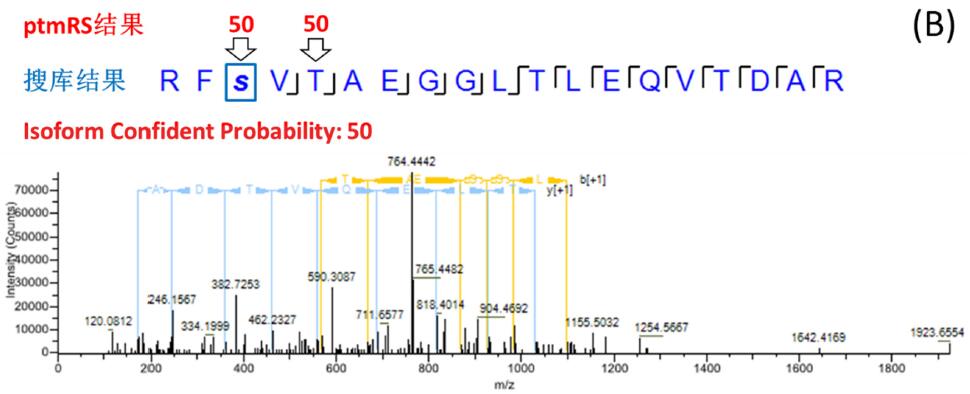
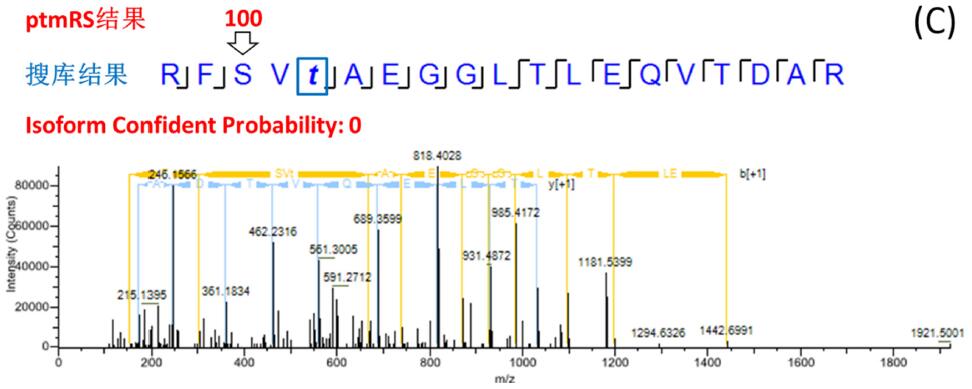
Figure 3. Example of consistent, partially consistent, and inconsistent search engine/ptmRS results
A total of 56,617 PSMs (FDR < 1%) were identified in the experiment. After Isoform Confident Probability screening, a total of 30,558 precisely-targeted, isoform-only phosphorylated peptide PSMs (Fig. 4) were obtained. The results were exported to mzML and PepXML formats.
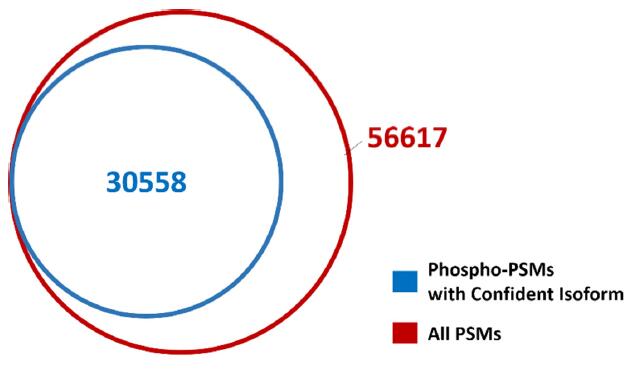
Figure 4. Comparison of PSM before and after Isoform Confident Probability screening
3. Phosphorylation sample DIA data analysis based on accurate spectral library
Import mzML and PepXML format files into Skyline to generate a phosphorylated peptide library for phosphorylation of peptide DIA data. Skyline peaks the DIA data with all peptides in the library as targets. Each parent peptide selects 3 parent ions (single isotope, monoisotopic +1, monoisotopic +2) and 6 b/y with the highest response. ion. Peak results were assessed using mProphet for false positives with a Q value < 0.01 (ie FDR < 1%) as a credible peak.
The results showed that 6401 credible phosphorylated peptides were extracted from the DIA data, accounting for 98.4% of the total number of peptide phosphorylated peptides (6505) (Fig. 5). The abundance and ionization efficiency of phosphorylated peptides are generally low. The high resolution success rate of this experiment indicates that the Orbitrap-based DIA data has extremely high spectral quality and excellent sensitivity.
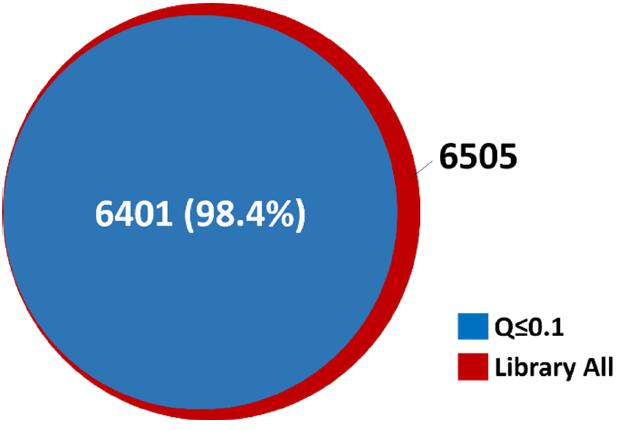
Figure 5. DIA's reliable analysis of phosphorylated peptides accounted for 98.4% of the total library
Further, the three-needle reproducibility of the peak area of ​​6401 phosphorylated peptides XIC was counted. The parent ion and daughter ion peak areas of each peptide were summed separately, and the results with the best reproducibility (ie, the lowest CV value) were used for quantification. It is generally believed that the quantitative results are reliable and accurate when the peak area CV value is < 20%. Statistical results showed that phosphorylated peptides with a peak area of ​​CV < 20% accounted for 86.9% of the total (Fig. 6). This high reproducibility shows that Orbitrap DIA not only has excellent sensitivity, but also has excellent reproducibility and is competent for complex post-translational modification quantification.
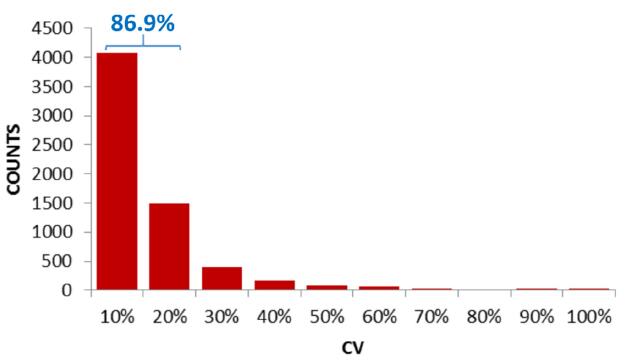
Figure 6. Peak area reproducibility (CV value) of phosphorylated peptides
Figure 7 shows the results of a typical phosphorylated peptide DIA analysis. The phosphorylated peptide has two isomers that are phosphorylated on serine at positions 3 and 9. Thanks to the high quality DIA spectra and the rigorous spectral library creation, even if the two isomers have very close retention times, they can be successfully and accurately resolved. The fragment abundance obtained by DIA is very close to that of the spectral library, and the dotp values ​​for matching scores are all above 0.95.
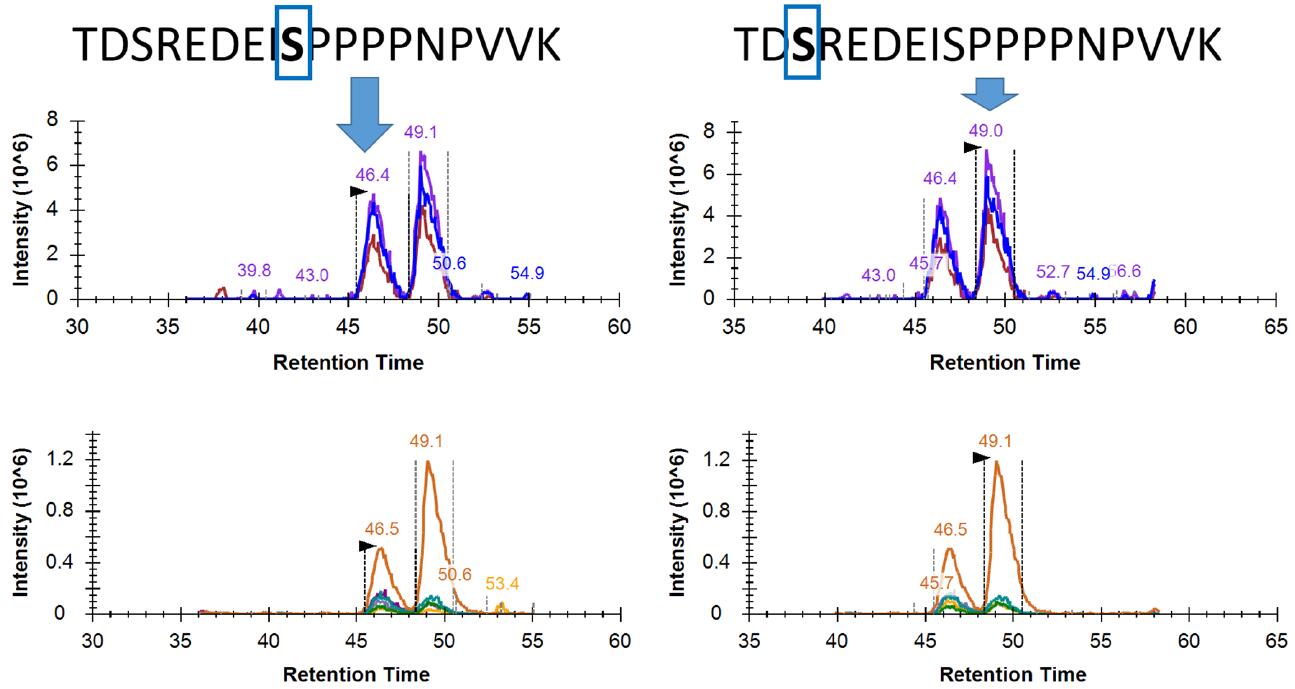
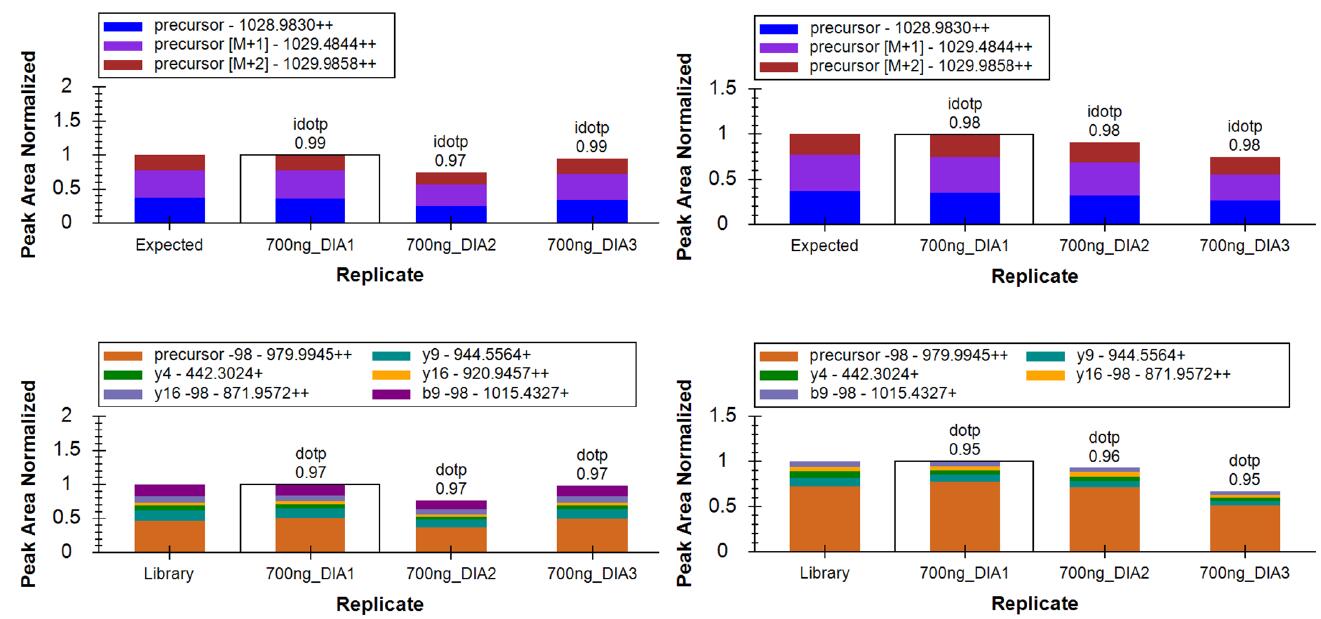
Figure 7. Resolution and matching scores for phosphorylated peptide isomers in DIA (dotp)
in conclusion
Post-translational modification Due to the multiplicity and uncertainty of the modification sites on the peptide, it is difficult to obtain reliable DIA results, which is the bottleneck of DIA development. On the other hand, the development of algorithms and software such as phosphoRS/ptmRS and MaxQuant makes DDA identification and localization of post-translational modification sites more accurate. Based on the above algorithm and software, the DDA identification results of phosphorylated samples were scored, and the accurate and reliable spectra were generated to establish a spectral library for DIA analysis. 6411 samples were successfully extracted from the phosphorylated sample DIA data. Reliable phosphorylated peptide (Q < 0.01), accounting for 98.4% of the total phosphorylated peptide in the library. Among them, 86.9% of the peptide peak area CV < 20%, can be used for accurate phosphorylation quantification. This strategy effectively solves the problem of post-translational modification DIA quantification, and proves that the DIA process based on Orbitrap ultra-high resolution mass spectrometry has excellent sensitivity and superior reproducibility, which is the best for quantitative quantification of complex samples, especially for post-translational modification. select.
references
[1] Multiplexed peptide analysis using data-independent acquisition and Skyline, Nat. Protoc., 2015, 10(6): 887-903
[2] Extending the limits of quantitative proteome profiling with data-independent acquisition and application to acetaminophen-treated three-dimensional liver microtissues, Mol. Cell. Proteomics, 2015, 14(5): 1400-1410
[3] MS1 Peptide Ion Intensity Chromatograms in MS2 (SWATH) Data Independent Acquisitions. Improving Post Acquisition Analysis of Proteomic Experiments, Mol. Cell. Proteomics, 2015, 14(9): 2405-2419
[4] Universal and confident phosphorylation site localization using phosphoRS, J. Proteome Res., 2011, 10(12): 5354-5362
[5] MaxQuant enables high peptide identification rates, individualized ppb-range mass accuracies and proteome-wide protein quantification, Nat. Biotechnol., 2008, 26(12): 1367-1372
3M Vhb Foam Tape,Gray Acrylic Tape,Acrylic Tape Adhesive,Double Sided Acrylic Foam Tape
Kunshan Jieyudeng Intelligent Technology Co., Ltd. , https://www.jerrytapes.com